Economic and Market Review April 2025

April 30, 2025
Overview
| Equity Indices | YTD Return |
| Dow Jones | -4.06% |
| S&P500 | -5.10% |
| NASDAQ | -9.51% |
| MSCI – Europe | 15.12% |
| MSCI–Emerging | 3.97% |
| Bonds (Yield) | |
| 2yr Treasury | 3.62% |
| 10yr Treasury | 4.18% |
| 10yr Municipal | 3.36% |
| U.S. Corporate | 5.34% |
| Commodities | |
| Gold | $3,244.28/oz |
| Silver | $32.37/oz |
| Crude Oil (WTI) | $58.20/bbl |
| Natural Gas | $3.35/MMBtu |
| Currencies | |
| CAD/USD | $0.73 |
| GBP/USD | $1.33 |
| USD/JPY | ¥143.06 |
| EUR/USD | $1.13 |
Overview
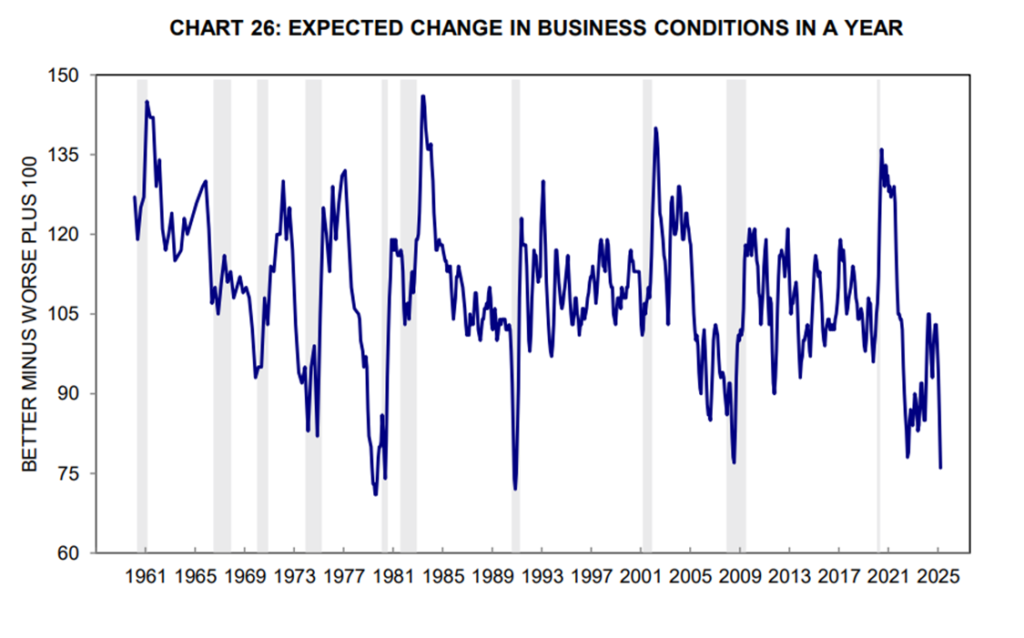
More than 70% of Americans now expect business conditions to be worse in 12 months. This is the highest level since 2008, and the third worst level on record since 1960.
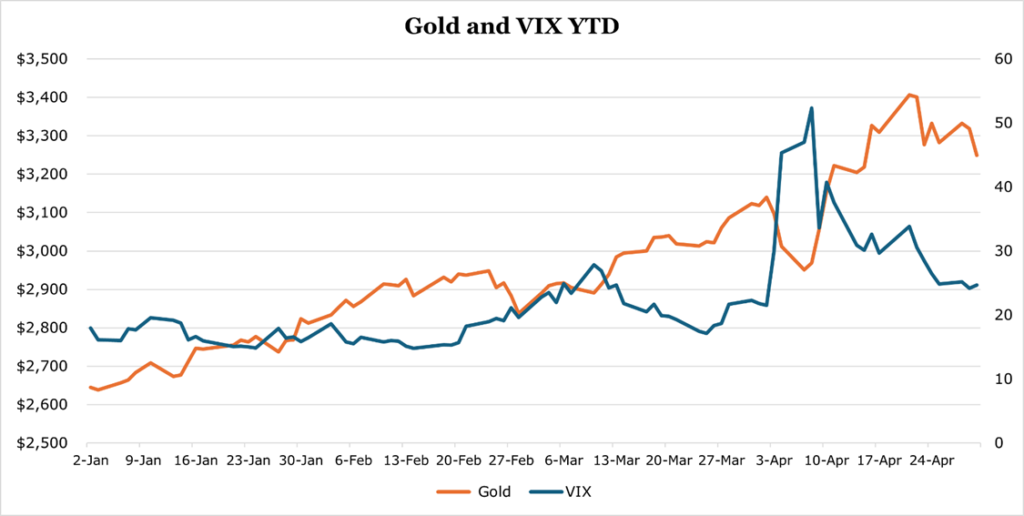
Volatility through the month was very high, with the VIX (volatility index) hitting its highest level since 2020, and gold posting all-time highs.
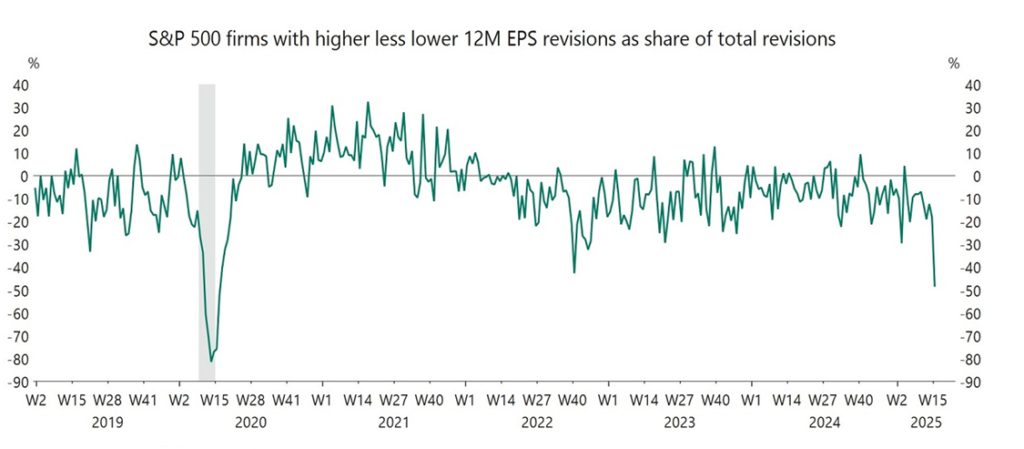
The S&P 500 has seen its worst 12-month forward earnings revision since the global pandemic, with a majority of firms now expecting weaker EPS by the end of 2025.
Equity and bond markets sharply recovered in the second half of April after a very tumultuous start to the month after the Trump admin announced tariffs and subsequently backed down on its harshest tariff measures. With the added benefit that reassuring comments regarding central bank independence were declared after earlier talk of replacing Powell. Though, on the last day of trading for the month, weaker than expected GDP data had stocks sliding once again.
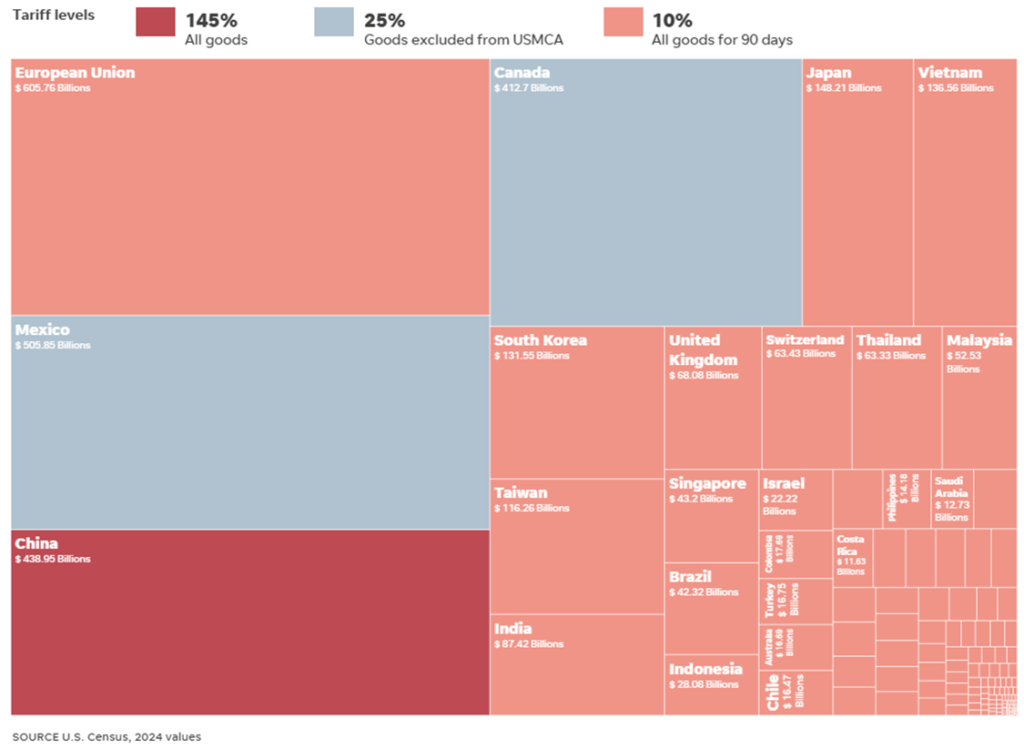
Still, 10% tariffs remain in place across the board on all countries, 25% on goods like steel and aluminum from Mexico and Canada, and 145% on all goods from China. The full host of tariffs will come into effect starting July 8th. Below is the current summary which is subject to and will change.
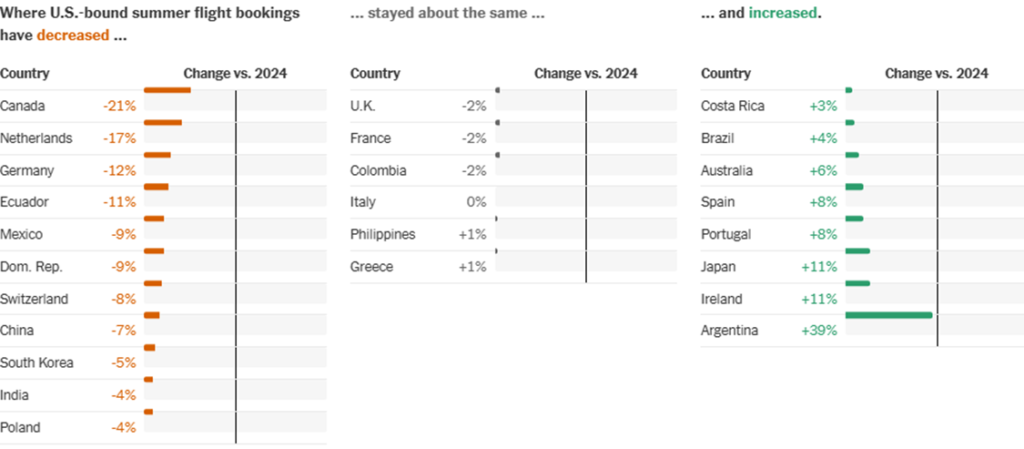
International tourism has collapsed from certain countries, while increasing from others. Compared to some sensational headlines, the aggregate effect is estimated to be a roughly 1.5-2.0% drop in international tourism during the summer months.
GDP Contracts While Spending Holds Up
Real GDP contracted by 0.3% for the quarter ending March 2025. Imports during the first quarter surged 41.3%, the largest since the global economy restarted post-pandemic in the latter part of 2020. As we have discussed before, this effect was mostly due to importers front-loading inventory orders to avoid tariffs and gold moving from LBMA to COMEX.
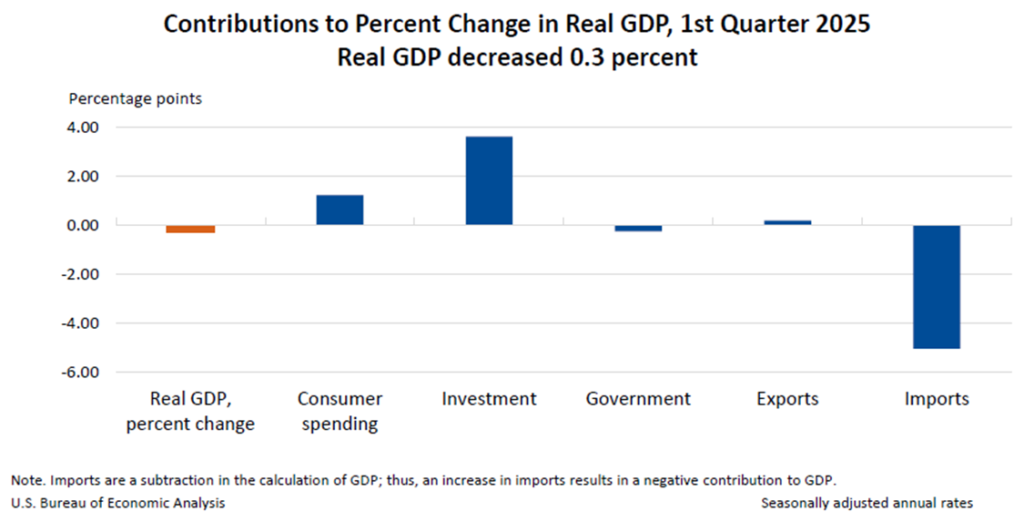
Government spending as a component of GDP contracted for the first time since 2022 as mass firings and the closing of programs cut spending.
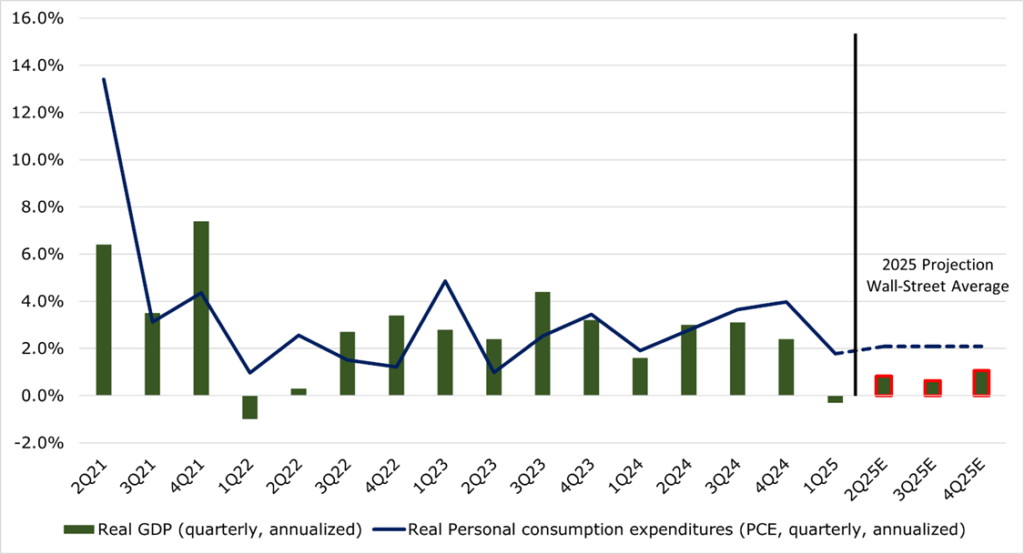
Wall Street now projects the year to end positive, albeit just, with the average real GDP growth projection now just 0.78%, compared to 2.05% when the survey was last conducted in January. Of the surveyed economists, 45% now project a recession compared to just 22% in January.
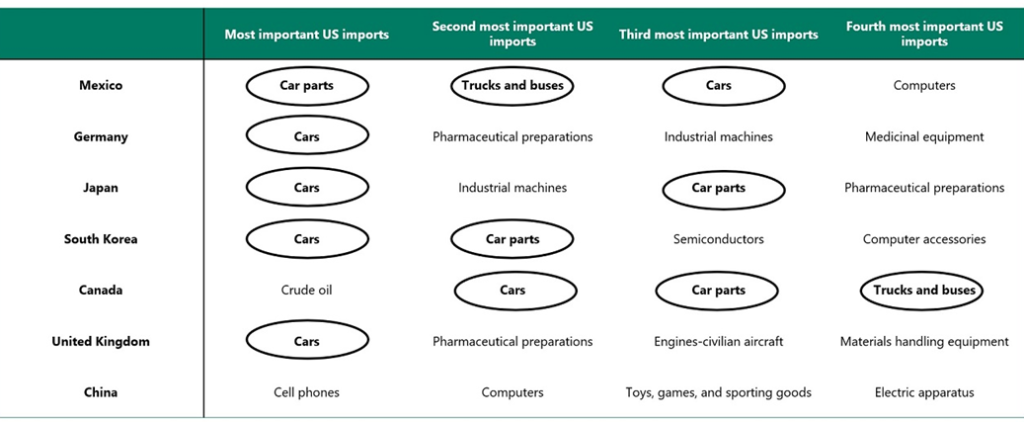
Most of these effects were weighted to the latter part of the quarter, and as a result consumer spending increased 2.3%. While still strong, 2.3% is a slowdown. Similar to imports data, the largest single category increase was motor vehicles and parts, indicating that consumers are also front-loading large purchases before tariffs hit. This is not surprising, as the largest single import from abroad is automotive and automotive components.
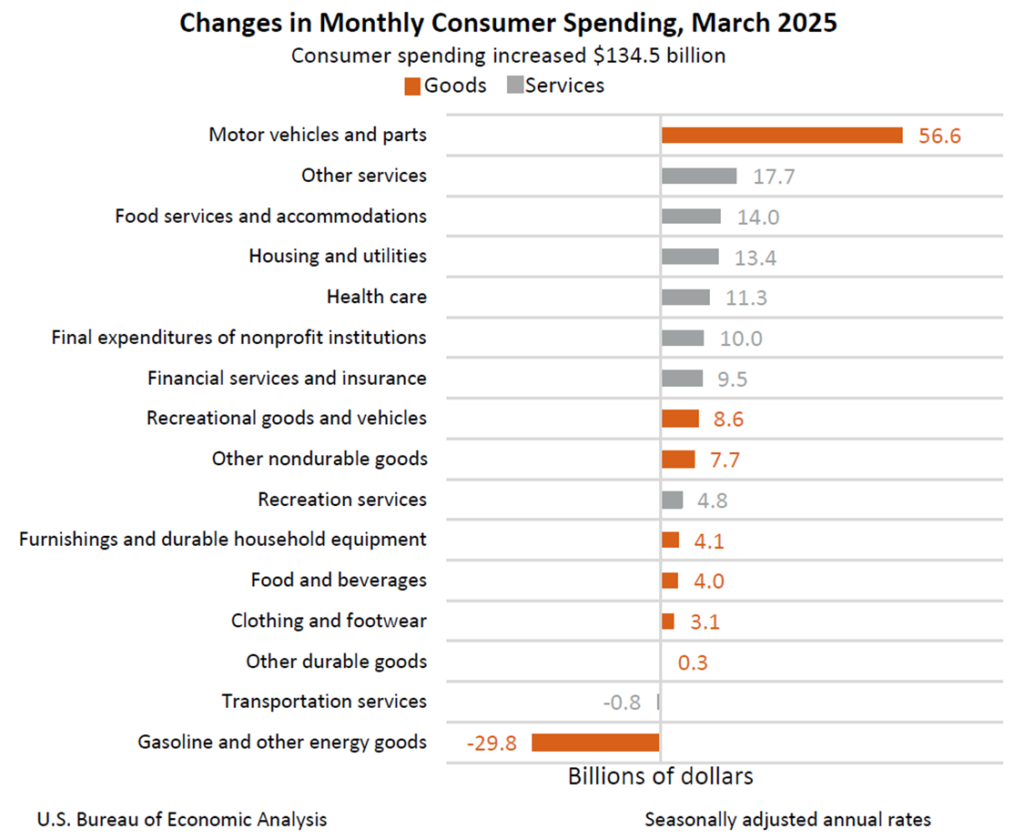
The drop in oil prices has decreased spending on energy, though not enough to offset the increase in automotive spending.
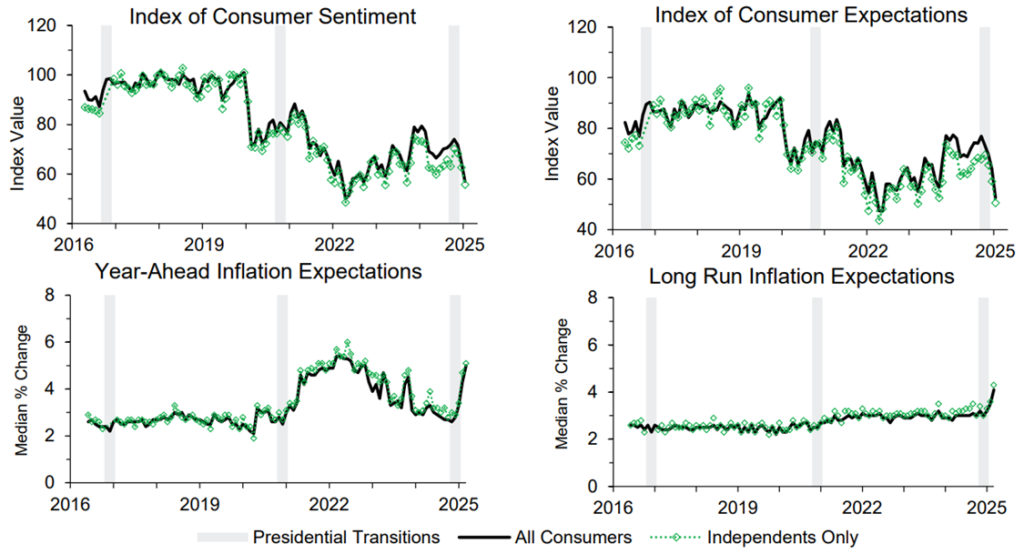
Overall, consumer sentiment has begun to collapse with inflation expectations appearing to become unanchored.
Imports Slowing, but Contraction is on the Horizon
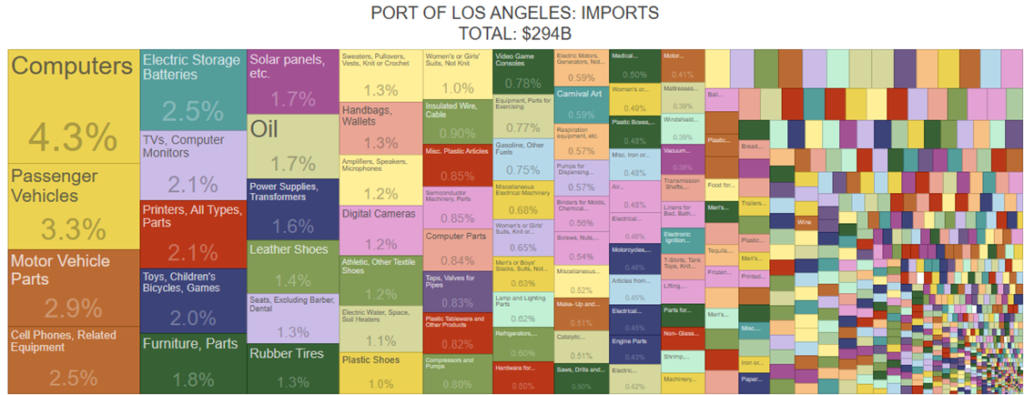
According to the Port of Los Angeles, there are 87 planned vessels to dock bringing in 189,039 containers. Averaged over the next 2 weeks, this represents a 19.1% decrease in containerized traffic year over year. Around 36% of the Port of Los Angeles goods by value are imported from China, followed by Japan at 13%, and Vietnam at 12%.
Typically, sea-shipping has a lead time of approximately 20-40 days. PMI inventories have reached their highest levels since 2022. This leaves around 7 weeks of inventories for retailers. By late May or early June, consumers will almost certainly begin to see empty shelves or substantial price increases.
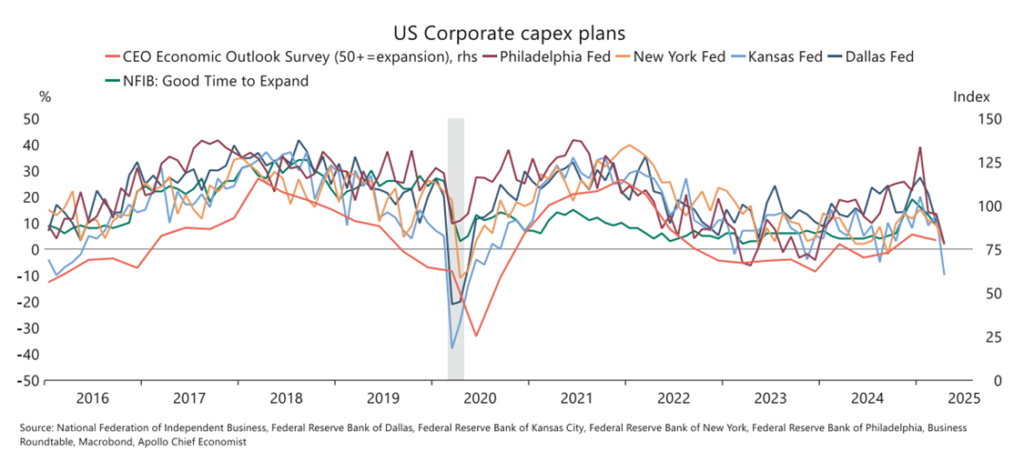
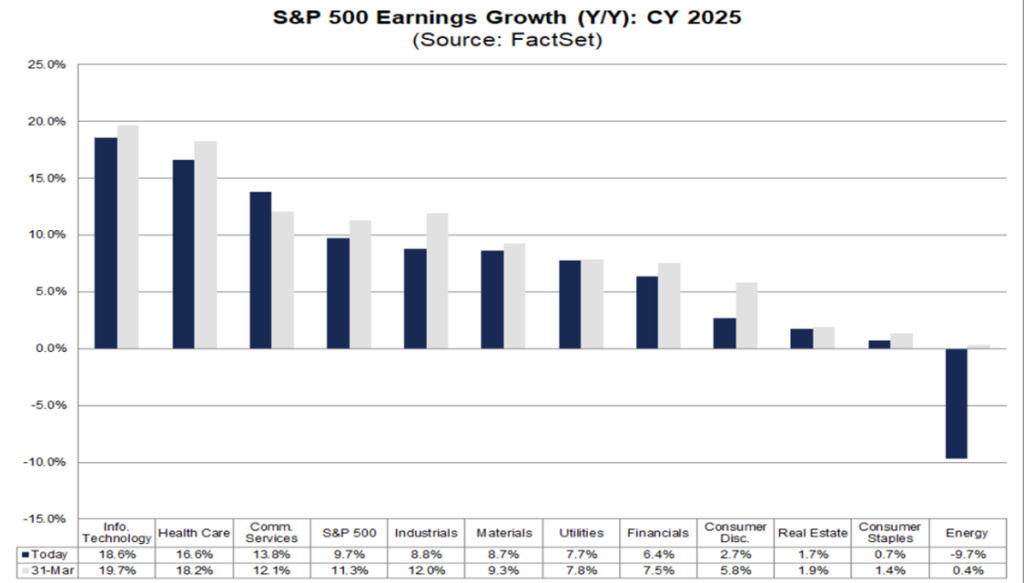
Contrary to the intent, it appears that most firms are also contracting capex spending plans, hoping to weather the storm rather than expand domestic capacity. Compared to March 31st estimates, EPS (Earnings Per Share) estimates have also collapsed, with only utilities and communication services seeing positive or flat revisions.