Economic and Market Review August 2024

August 30, 2024
| Equity Indices | YTD Return |
| Dow Jones | 8.54% |
| S&P500 | 16.57% |
| NASDAQ | 16.05% |
| MSCI – Europe | 8.66% |
| MSCI–Emerging | 7.81% |
| Bonds (Yield) | |
| 2yr Treasury | 3.86% |
| 10yr Treasury | 3.83% |
| 10yr Municipal | 2.69% |
| U.S. Corporate | 4.94% |
| Commodities | |
| Gold | $2,492.24/oz |
| Silver | $28.03/oz |
| Crude Oil (WTI) | $70.39/bbl |
| Natural Gas | $2.21/MMBtu |
| Currencies | |
| USD/CAD | $0.74 |
| USD/GBP | $1.31 |
| USD/JPY | ¥145.57 |
| USD/EUR | $1.10 |
Overview
Stocks have largely recovered from the almost 10% correction seen early in August, which was the worst start to a month since 2002. However, in just 11 trading days the market had recovered and even came near its record July highs.
While the Fed has begun to telegraph it will likely cut before the year is out, the market may be jumping the gun, pricing in an aggressive 100bps cut by the end of the year. For September, 63% expect a 25bps cut, and 37% expect a 50bps cut.
The bond market reflected this aggressive pricing, with Treasury yields dropping 30bps in August, the largest decline in 2024.
With just 3 Fed meetings left before the end of the year, and economic data continuing to conflict, we feel it is highly unlikely the Fed will deliver 100bps.
Gold hit record highs during August, even as other commodities like Oil continued to be weak. Natural gas prices were relatively flat in August, with a slight increase in early September as the Biden administration reconsidered pausing LNG export permits.
Banking’s Shaky Foundations Begin to Show
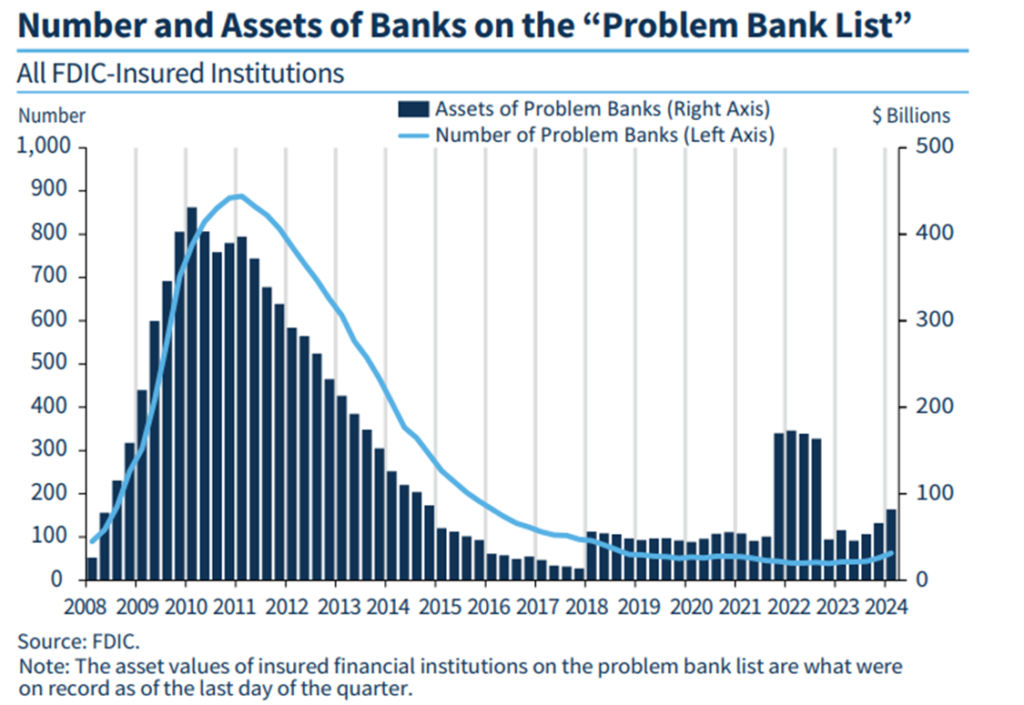
The number of banks on the “problem” list has begun to creep up. The problem list is a non-public list of banks the FDIC believes are in jeopardy of near-term failure. Notably, none of the 3 largest bank failures in 2023 were on this list before they failed.
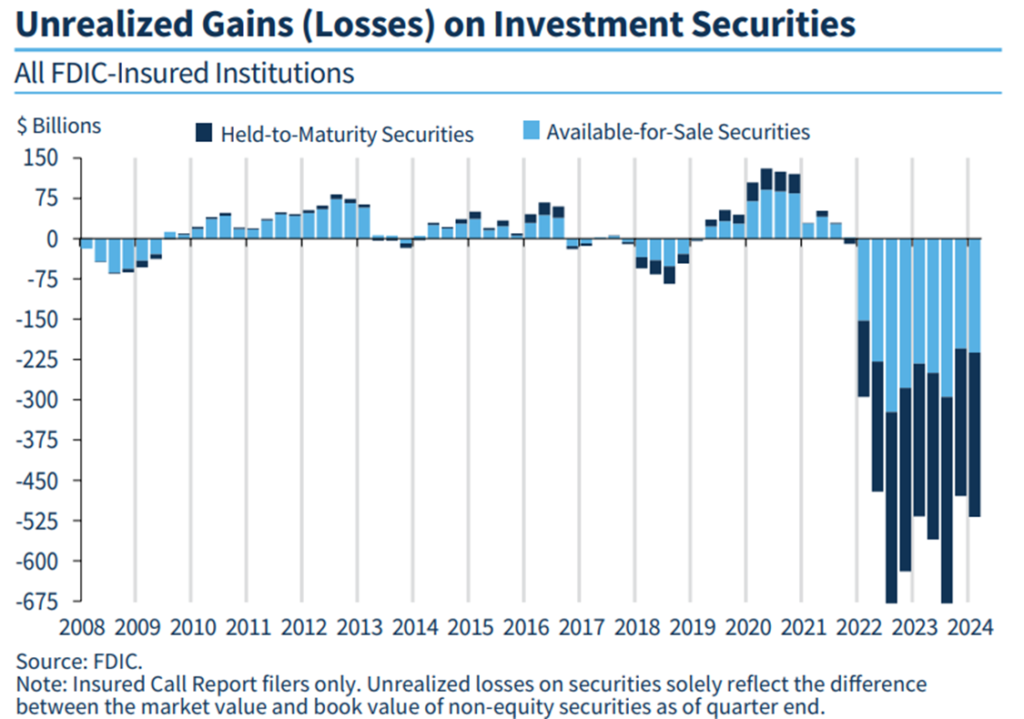
Overall unrealized losses are now at $517 billion for the first quarter of 2024. At least 50 banks reported unrealized losses exceeding 50% of their Tier-1 equity value. Tier-1 capital refers to the most liquid bank holdings: cash, common stock, retained earnings, and realized gains on securities.
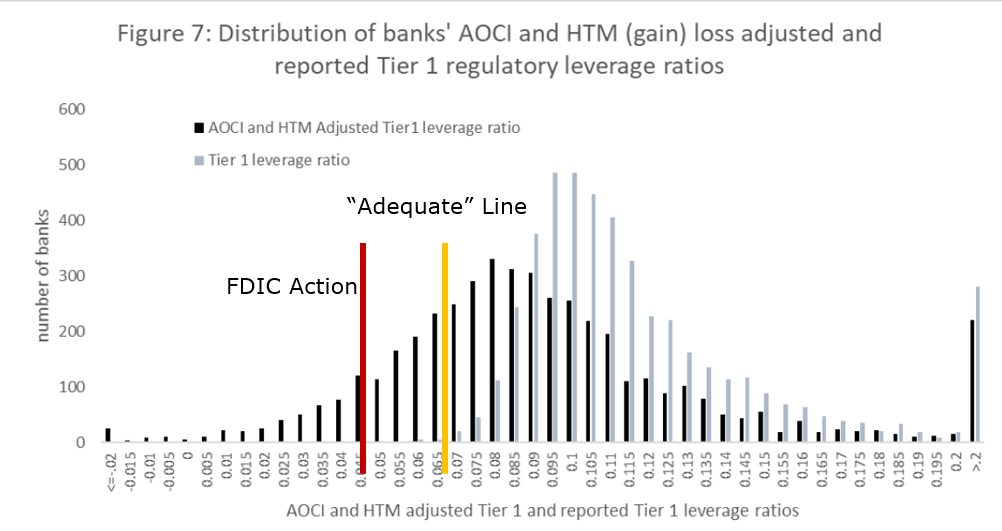
Bank solvency and security are measured by the ratio of Tier-1 capital to risk-weighted assets, including loans and investment-related unrealized gains and losses. The FDIC typically considers a bank at risk if this ratio falls below 6.5%, with corrective action initiated below 4.5%. If a bank realizes losses exceeding 50% of its Tier-1 capital, the FDIC may seek closure, even if the risk ratio remains above the critical threshold.
Among the 4,697 banks with over $1 billion in assets, 22 have potential losses exceeding 100% of Tier-1 capital, and 275 have losses over 50%. Bigger names on the list are Charles Schwab with 64% unrealized loss on equity, USAA with 67%, and Bank of America with 58%.
Typically, banks hold securities to maturity, meaning they may not realize these losses. However, if banks sell securities to cover withdrawals or issue new loans, it could lead to significant liquidity problems.
If these losses are realized, 21% of the banking system’s assets would enter the risk zone, with an additional 18% potentially requiring FDIC intervention.
The “Quiet Recession”
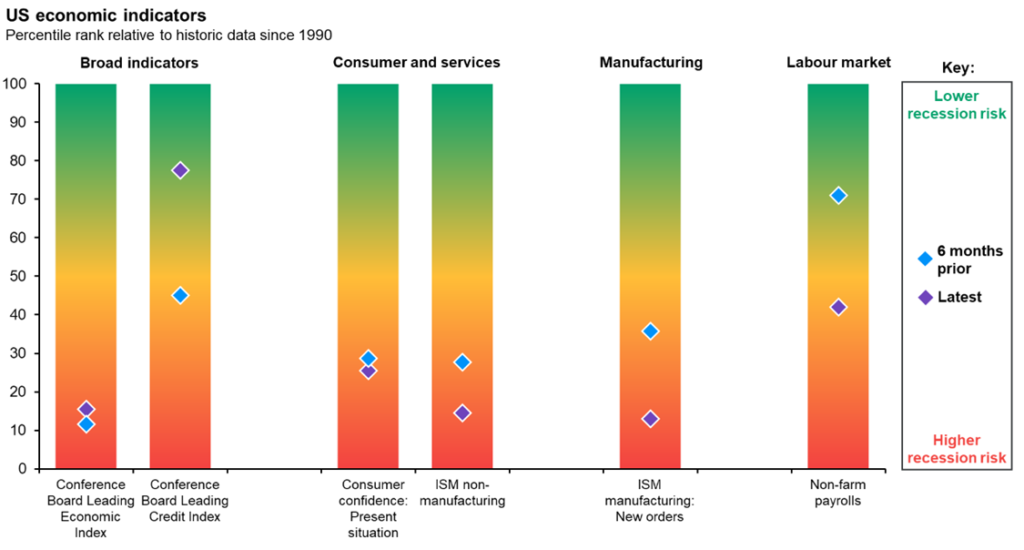
Economic conditions are the weakest since the early stages of the COVID-19 pandemic. By most metrics, the US economy is fragile and nearing a recession.
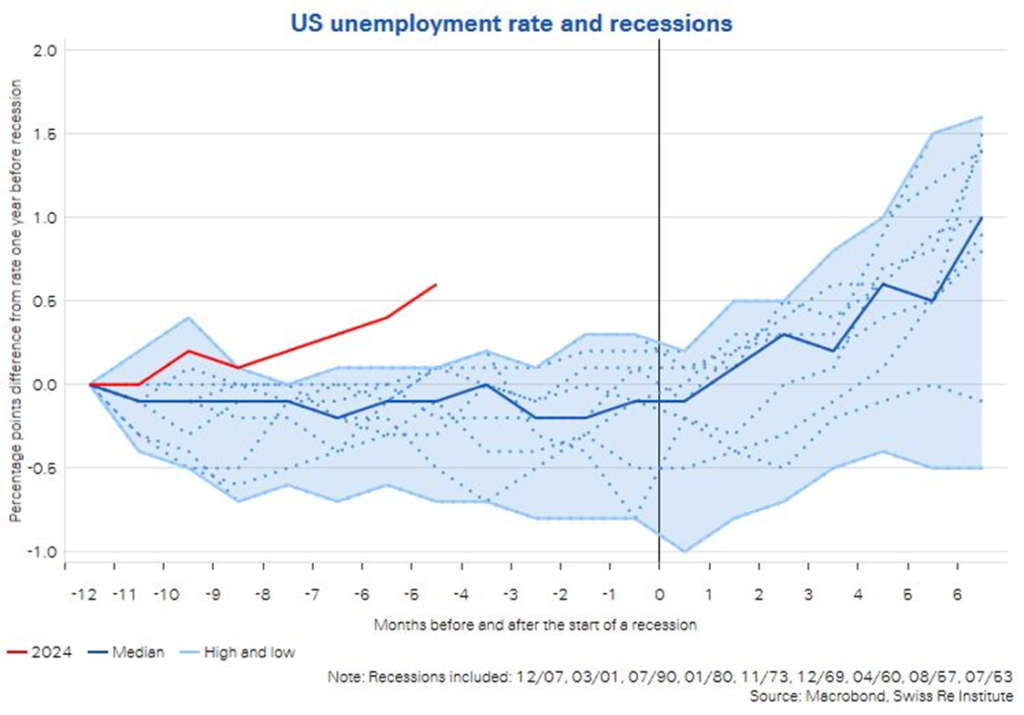
nemployment has increased enough to trigger the Sahm Rule, indicating the economy is in a recession. The Sahm Rule is triggered when unemployment rises by 0.5 percentage points from the 12-month low. Every time the rule has been triggered since 1950, a recession has been declared within a year.
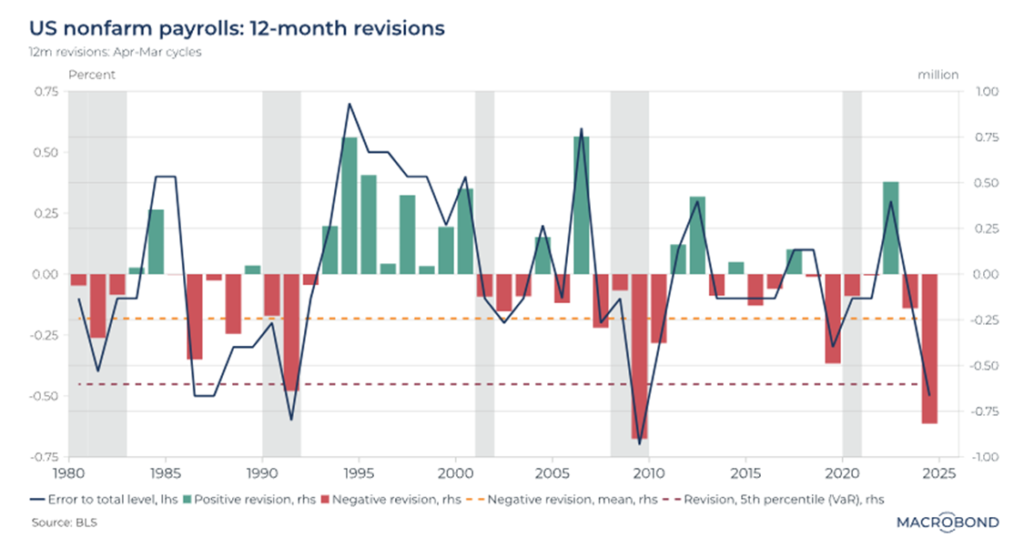
The labor market has been the economy’s saving grace, though significant downward revisions have weakened this support. Significant downward revisions often indicate an impending recession.
Despite Cuts on the Horizon, Inflation Stays High
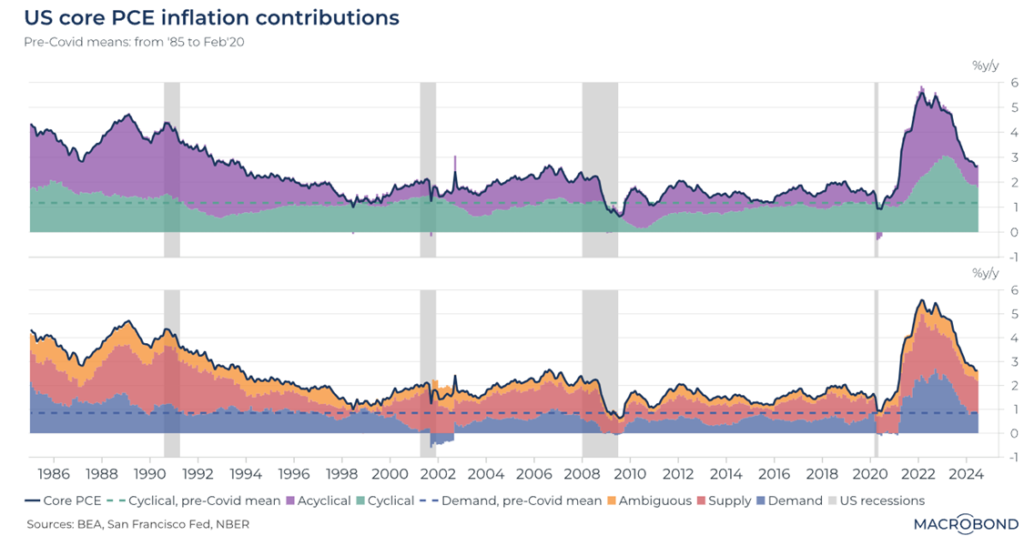
Acyclical inflation, driven by specific inputs rather than broad conditions, shows signs of declining. However, supply inflation remains high. These conflicting indicators suggest that some parts of the economy are disinflating while others remain stressed.
If the Fed focuses on declining acyclical inflation, it might underestimate supply-side pressures and cut rates too aggressively, risking stagflation. Conversely, focusing on supply-driven inflation might lead the Fed to maintain tight monetary policies, risking a deep recession.
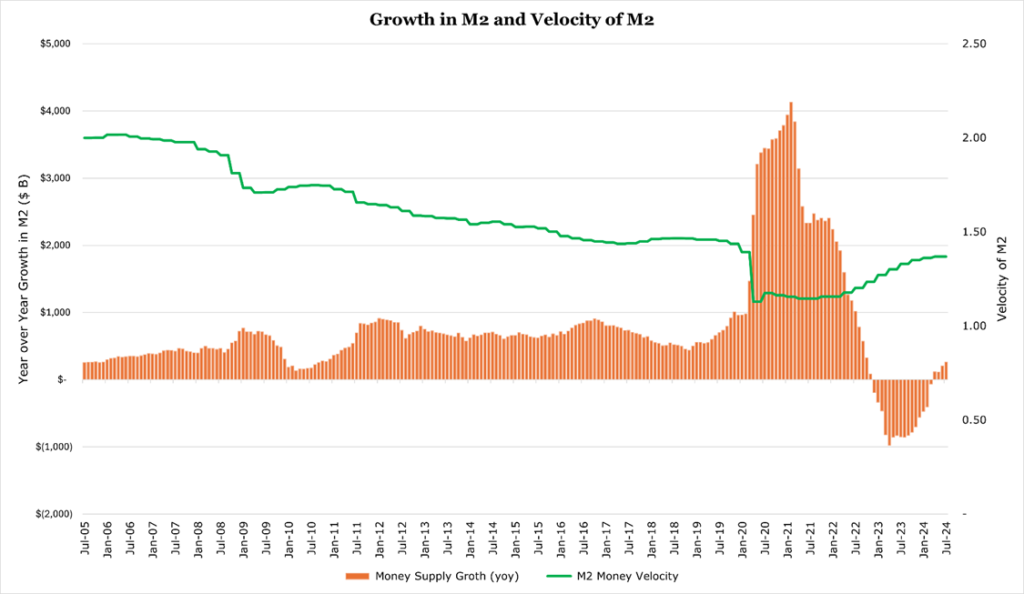
After a 16-month contraction, the M2 money supply is increasing again, though velocity remains stagnant despite some recovery. The M2 money supply includes money in circulation, savings accounts, CDs, and money market funds. The velocity of money measures the rate at which money circulates in the economy, a bellwether for economic activity. A growing money supply with low velocity generally indicates a sluggish economy with an inflation rate too low relative to the money supply.
Consumers in the Toughest Spot Since 2008
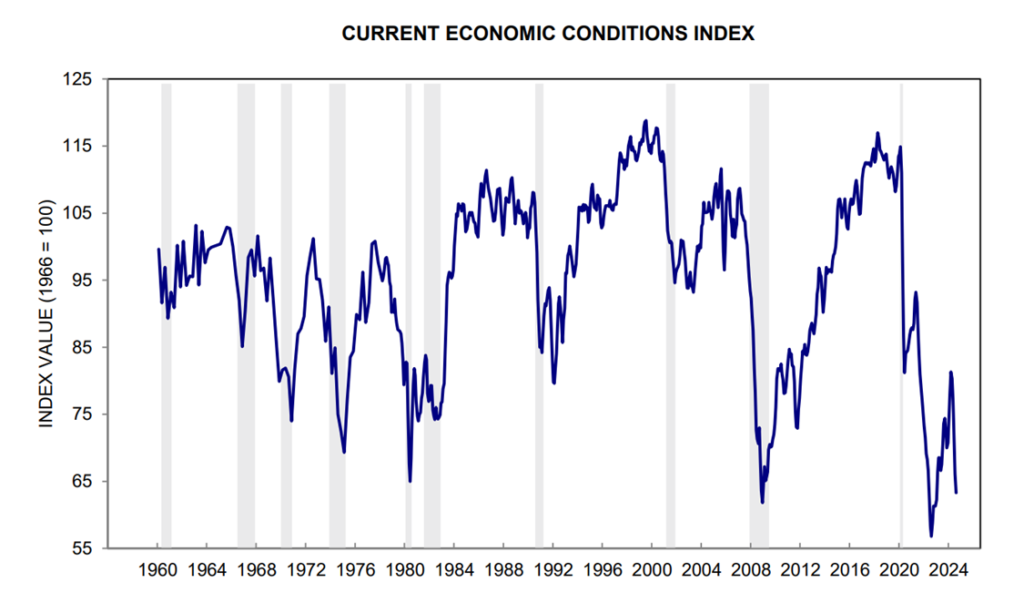
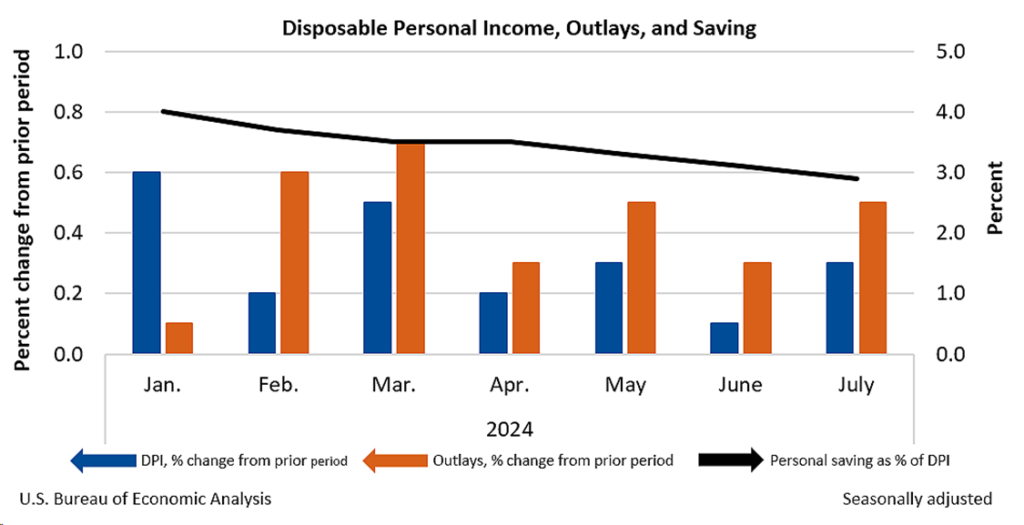
The four major components of the Current Economic Conditions Index are payroll, personal income, manufacturing, and industrial productivity. All of these are well-regarded as indicators that impact consumers in the short-term the most. While Q2 GDP grew by 3.0% year over year and disposable personal income has risen above inflation, consumers are still using personal savings to supplement spending, which continues to outpace earnings growth.
In the housing market, the pending home sales index has hit a record low, significantly below levels seen in 2008.
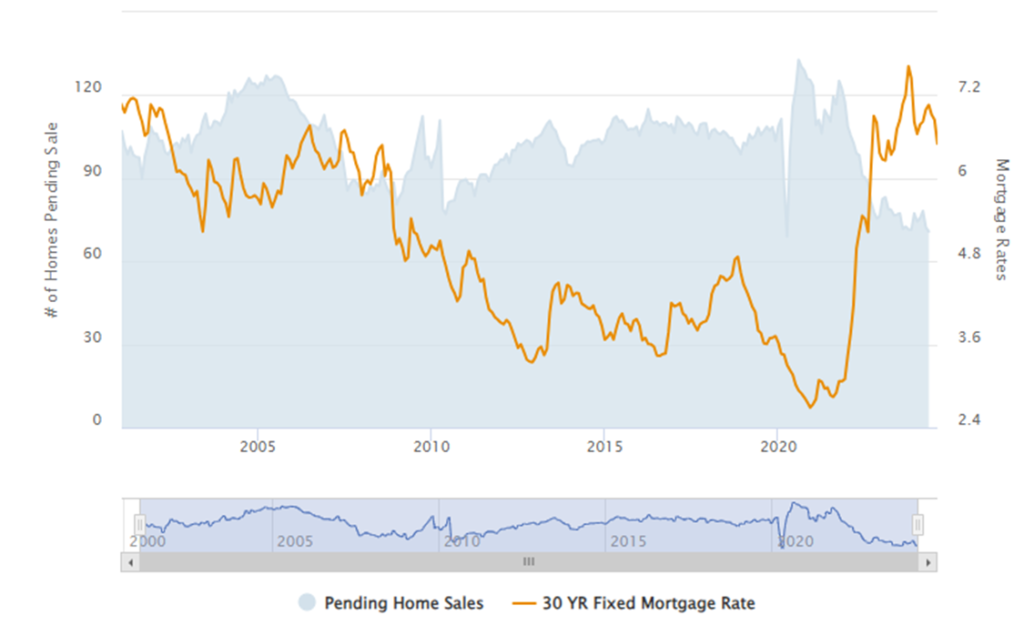
Given that the US population has grown nearly 20% since 2008, and mortgage rates are now similar to 2001 levels when the index began, this figure is even more striking.
If not Treasuries, then Gold?
The pace of QE has slowed, with asset reductions at 12% year over year, down from a 14% peak in March 2024.
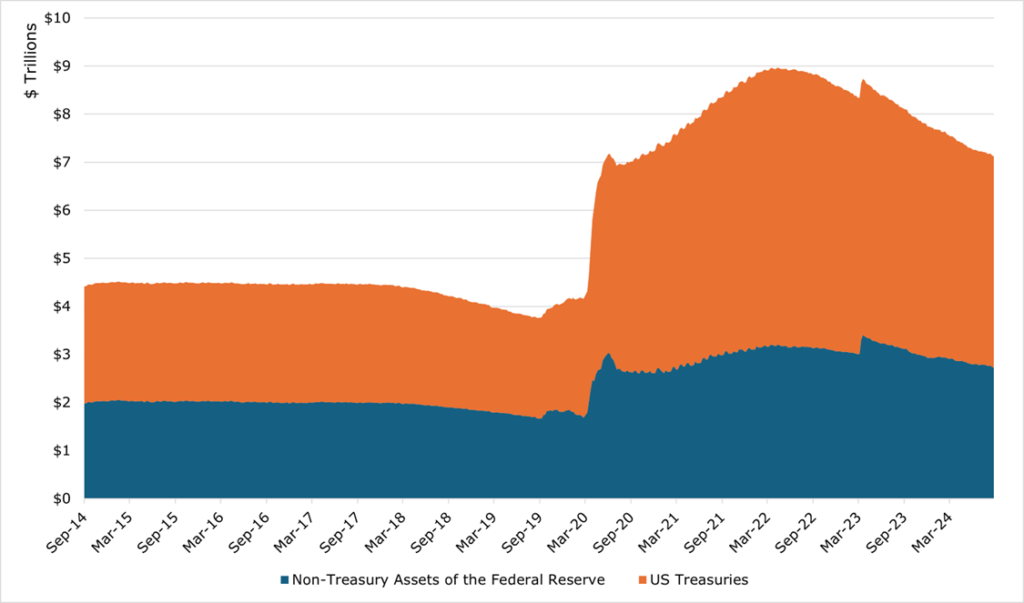
In September 2014, the balance sheet contained 55.2% treasuries. The Balance sheet peaked at 64.7% of Treasuries in June 2022 and now currently sits at 61.8%. We have previously discussed the decreasing demand for Treasuries globally in the face of record-high volumes of issuance, and how that may lead to monetization of the debt.
Amid a strong US dollar and persistent inflation, central banks have accelerated gold purchases. Demand for gold is up 6% year over year, reaching 183 tons. In the first half of 2024, central banks purchased 483 tons of gold, setting a new record.
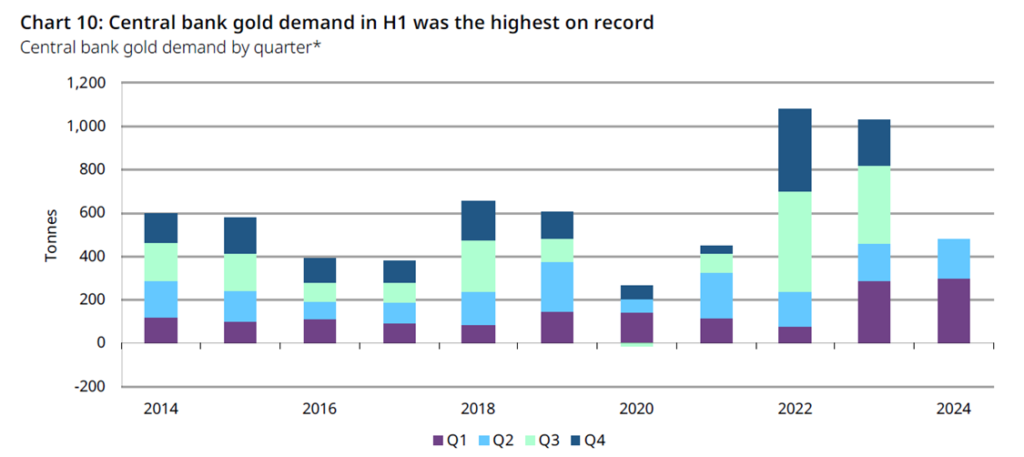
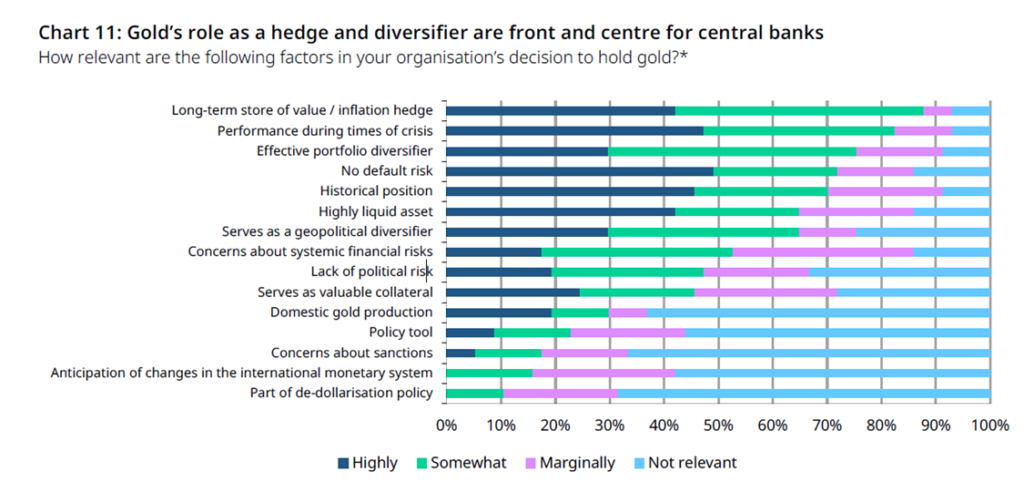
The reasons for these purchases are more consistent than they were when we first covered this shake up, with most now stating that it is a better inflation proof store of value. Additionally, 81% of central banks expect gold holdings to increase over the next 12 months.
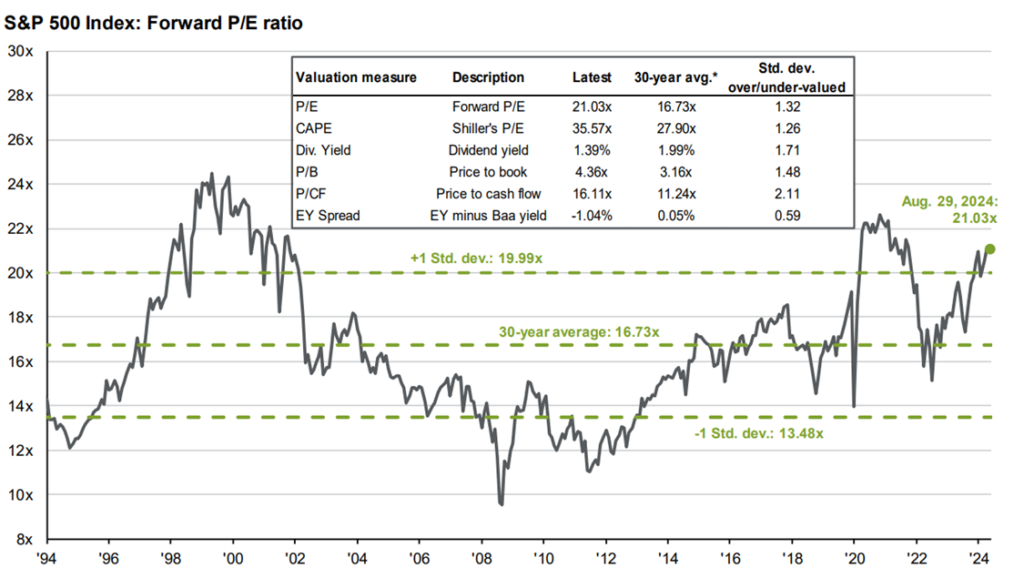
Despite Some Pullback, Concentration Remains High
June 2024 saw an all-time high in S&P 500 concentration, peaking at 34%. The market remains highly concentrated at 30% in the “Magnificent 7”.
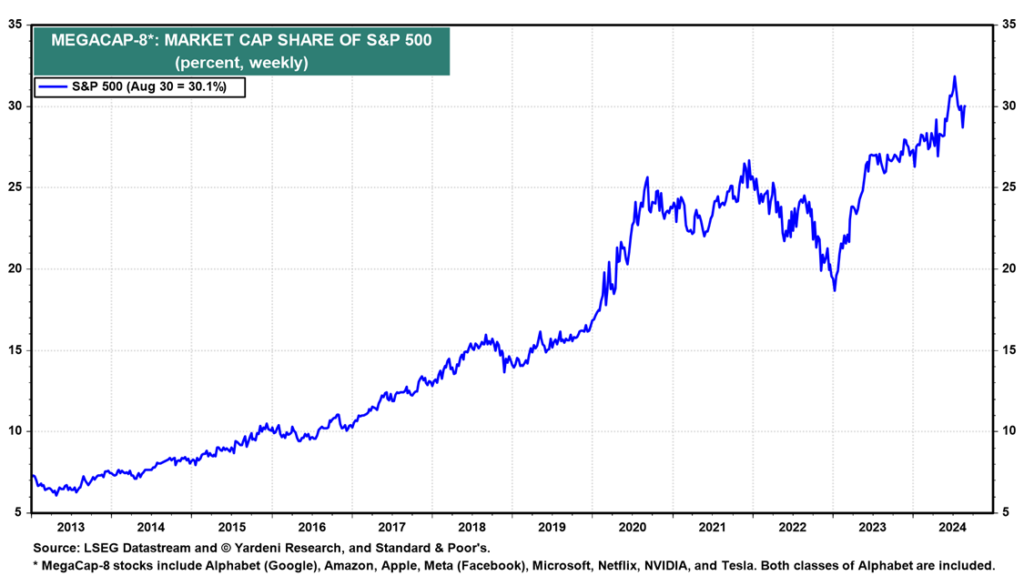
This trend extends beyond the S&P 500. Growth sectors (tech, telecom, healthcare) now make up 44% of global market capitalization, while value sectors (financials, energy, materials) have shrunk to a near-record low of 25%.
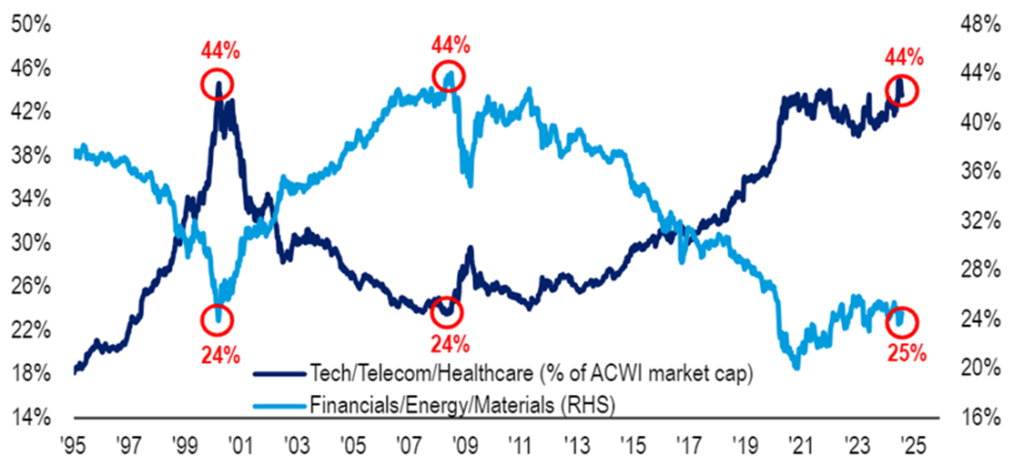
These sectors didn’t experience a sudden downturn. Even when value sectors outperformed growth, they still remained under 30% of the market. Typically, any valuation metric above 1 standard deviation from the mean indicates an overvalued market. he market’s current valuation rivals the dot-com bubble of 2000, with concentration levels similarly high.